The Ultimate Guide to Contact Center Metrics: 12 KPIs That Actually Move the Needle
In the high-stakes world of customer service, what you don't measure, you can't improve. But with countless metrics vying for attention, which ones truly deserve your dashboard real estate? Let's cut through the noise and focus on the metrics that genuinely impact your bottom line and transform customer experiences.
Why Measuring Contact Center Performance Matters
Think of contact center metrics as your business's vital signs. Just as a doctor monitors heart rate and blood pressure, these KPIs provide crucial insights into your operation's health. In today's customer-centric landscape, these measurements aren't just numbers—they're narratives about your customer relationships and operational excellence.
Essential Customer Experience Metrics
1. Customer Satisfaction Score (CSAT)
CSAT remains the gold standard of customer experience metrics. It's the direct feedback loop between your service delivery and customer perception. But here's what many miss: CSAT isn't just about collecting scores—it's about understanding the stories behind them.
Best practices for optimizing CSAT:
- Implement immediate post-interaction surveys
- Analyze trends across different channels
- Use visual support tools to enhance resolution clarity
2. Net Promoter Score (NPS)
While CSAT measures immediate satisfaction, NPS reveals long-term loyalty potential. It's the crystal ball that predicts your customer relationships' future. Studies show that companies with high NPS scores typically grow at more than twice the rate of their competitors.
3. Customer Effort Score (CES)
In an era where convenience is king, CES might be your most undervalued metric. It measures how hard customers have to work to get their issues resolved—and research shows that reducing customer effort is the surest path to loyalty.
Critical Agent Performance Metrics
4. First Contact Resolution (FCR)
FCR is the holy grail of contact center efficiency. When agents resolve issues on the first contact, it's a win-win: customers save time, and centers reduce costs. Modern visual assistance tools have revolutionized FCR rates, with some centers reporting improvements of up to 20%.
5. Average Handle Time (AHT)
While AHT is crucial, it's often misunderstood. The goal isn't always to minimize it—it's to optimize it. The sweet spot lies where efficiency meets effectiveness.
6. Agent Utilization Rate
This metric reveals how effectively you're using your most valuable resource—your agents. The ideal utilization rate typically falls between 75-85%. Push beyond that, and you risk burnout; fall below, and you're leaving productivity on the table.
Operational Efficiency Metrics
7. Service Level
The classic "80/20" rule (answering 80% of calls within 20 seconds) isn't just an industry standard—it's a baseline for customer expectations. Modern contact centers are pushing these boundaries with innovative queue management and visual support tools.
8. Average Speed of Answer (ASA)
Every second counts in ASA. Research shows that after just 2 minutes of waiting, customer satisfaction drops by 33%. Smart centers are using predictive analytics to optimize staffing and reduce wait times strategically.
9. Queue Time
Queue time isn't just about waiting—it's about perception. Centers using interactive queue management and callback options report higher satisfaction scores, even with longer actual wait times.
Volume and Capacity Metrics
10. Call Volume Patterns
Understanding your volume patterns is like weather forecasting for your contact center. It's not just about handling today's calls—it's about predicting and preparing for tomorrow's surge.
11. Abandonment Rate
Every abandoned call represents a frustrated customer and potential lost revenue. The industry benchmark is below 5%, but leading centers aim for 3% or lower through smart queuing and proactive engagement strategies.
12. Channel Distribution
In our omnichannel world, understanding how customers choose to reach you is crucial. This metric helps optimize resource allocation and identify opportunities for channel shift.
Leveraging Technology for Metric Improvement
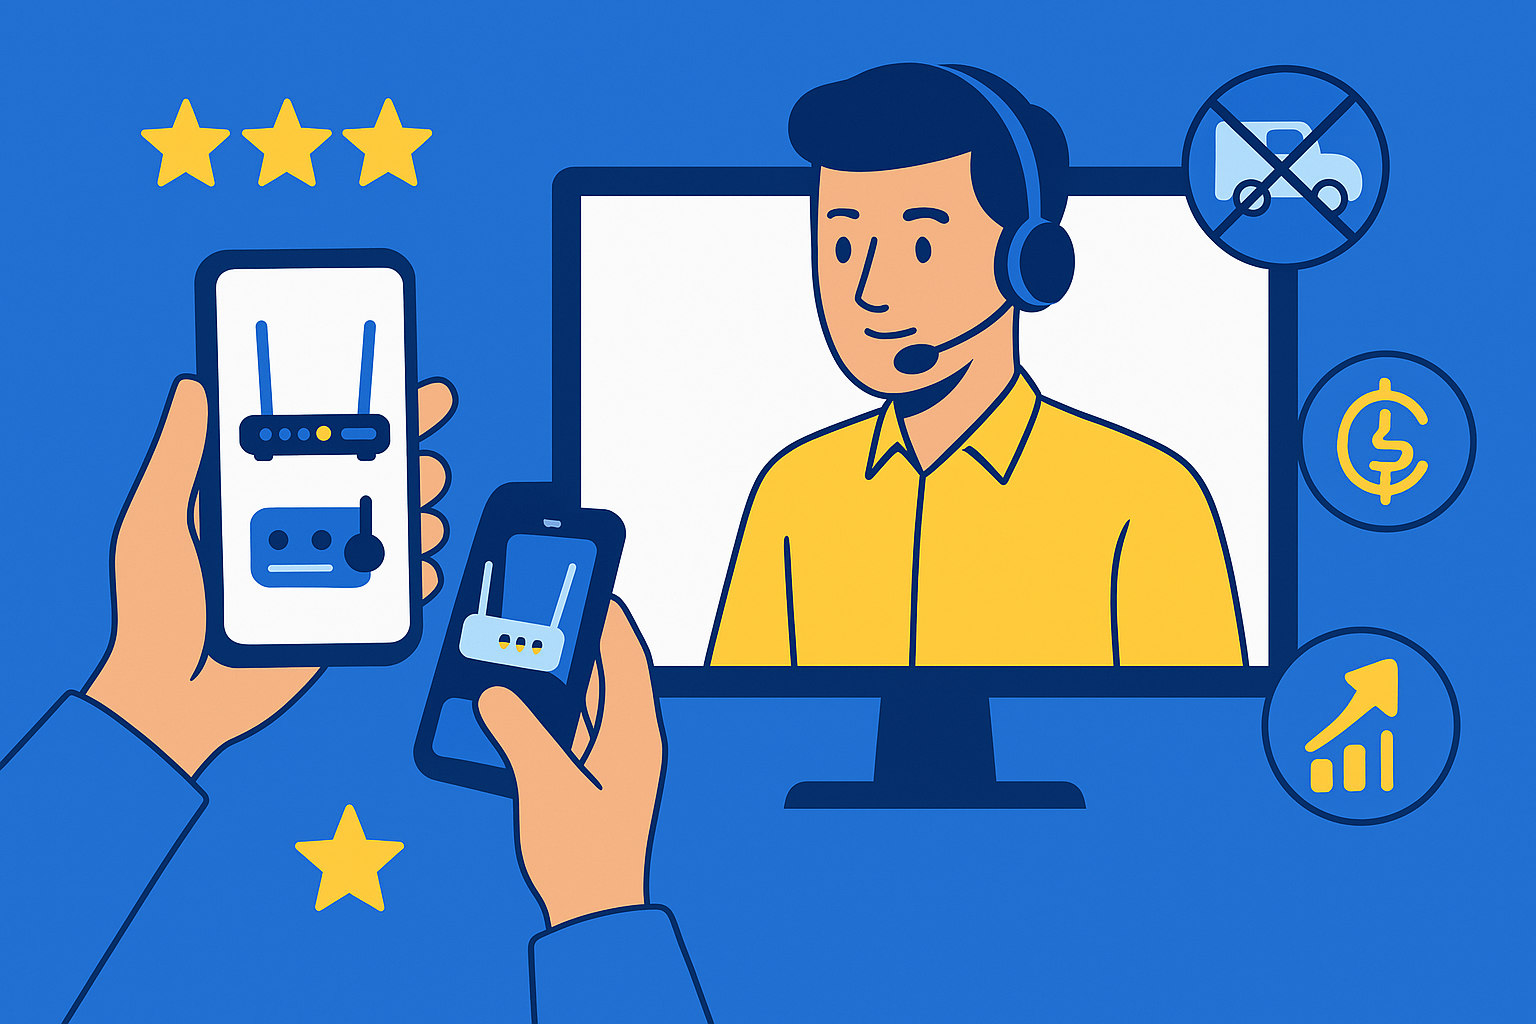
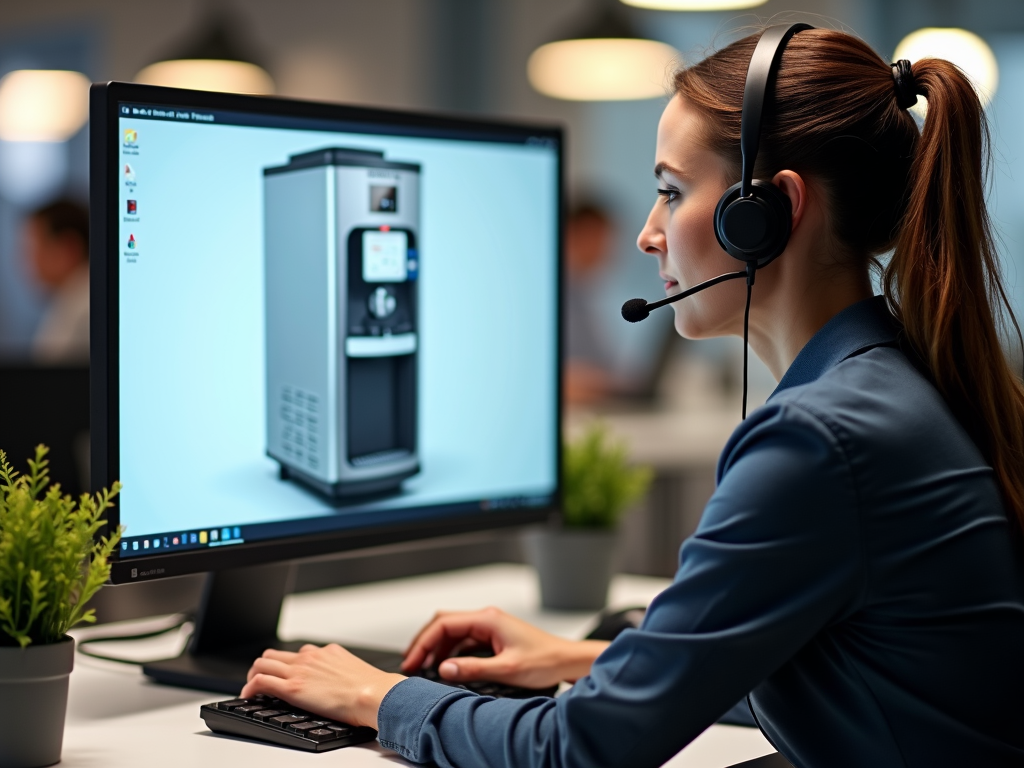
Modern contact centers are supercharging these metrics with visual assistance tools. These solutions enable agents to:
- See what customers see in real-time
- Guide customers through complex processes visually
- Resolve issues faster and more accurately
Best Practices for Metric Implementation
Success with metrics requires more than measurement—it demands action. Consider these implementation strategies:
- Set realistic benchmarks based on your industry and resources
- Review metrics weekly and adjust strategies accordingly
- Share insights across teams to foster collaborative improvement
- Invest in training and tools that support metric achievement
Conclusion
The right metrics, measured correctly and acted upon consistently, can transform your contact center from a cost center to a value creator. But remember: metrics are means, not ends. They're tools to help you deliver better customer experiences and drive business growth.
Ready to elevate your contact center metrics? Discover how visual assistance can transform your customer service operations.
Want to see these improvements in action? Schedule a demo of Blitzz Remote Support today and watch your metrics soar.
FAQs
What are the most important KPIs every contact center should track?
The essential KPIs for contact centers include Customer Satisfaction Score (CSAT), First Contact Resolution (FCR), Average Handle Time (AHT), Service Level, and Abandonment Rate. These metrics provide a comprehensive view of customer experience, agent performance, and operational efficiency. Each metric offers unique insights: CSAT measures customer happiness, FCR indicates issue resolution effectiveness, AHT shows operational efficiency, Service Level demonstrates availability, and Abandonment Rate reveals potential lost opportunities.
How can visual assistance tools improve contact center metrics?
Visual assistance tools significantly enhance contact center performance by improving First Contact Resolution rates through better problem diagnosis, reducing Average Handle Time by enabling agents to see and resolve issues faster, and increasing Customer Satisfaction by providing a more interactive support experience. These tools also help maintain lower queue times and improve agent efficiency by enabling more accurate problem-solving on the first attempt.
What is a good First Contact Resolution (FCR) rate, and how can it be improved?
Industry standards consider an FCR rate of 70-75% to be good, while best-in-class contact centers achieve rates of 80% or higher. To improve FCR, centers should focus on comprehensive agent training, implement visual assistance tools, maintain updated knowledge bases, and ensure proper call routing to specialists. Regular monitoring and analysis of repeat contact reasons can help identify areas for improvement.
How do you balance Average Handle Time (AHT) with customer satisfaction?
The key to balancing AHT with customer satisfaction is focusing on efficiency without sacrificing quality. This can be achieved by providing agents with proper tools and training, implementing streamlined processes, and using visual assistance technology when needed. Rather than pushing for the shortest possible handle time, aim for an optimal time that ensures thorough problem resolution while maintaining customer satisfaction.
What's the relationship between Service Level and customer satisfaction?
Service Level, typically expressed as the percentage of calls answered within a specific time threshold (e.g., 80% of calls answered within 20 seconds), directly impacts customer satisfaction. Higher service levels generally correlate with improved customer satisfaction as customers experience shorter wait times. However, maintaining high service levels requires proper staffing, efficient queue management, and effective use of technology. The ideal service level varies by industry but typically ranges between 70-90%.
.png?width=120&height=55&name=Blitzz-Logo-right%20white%20eyes%20-%20not%20transparent%20(3).png)


