

.png?width=120&height=55&name=Blitzz-Logo-right%20white%20eyes%20-%20not%20transparent%20(3).png)
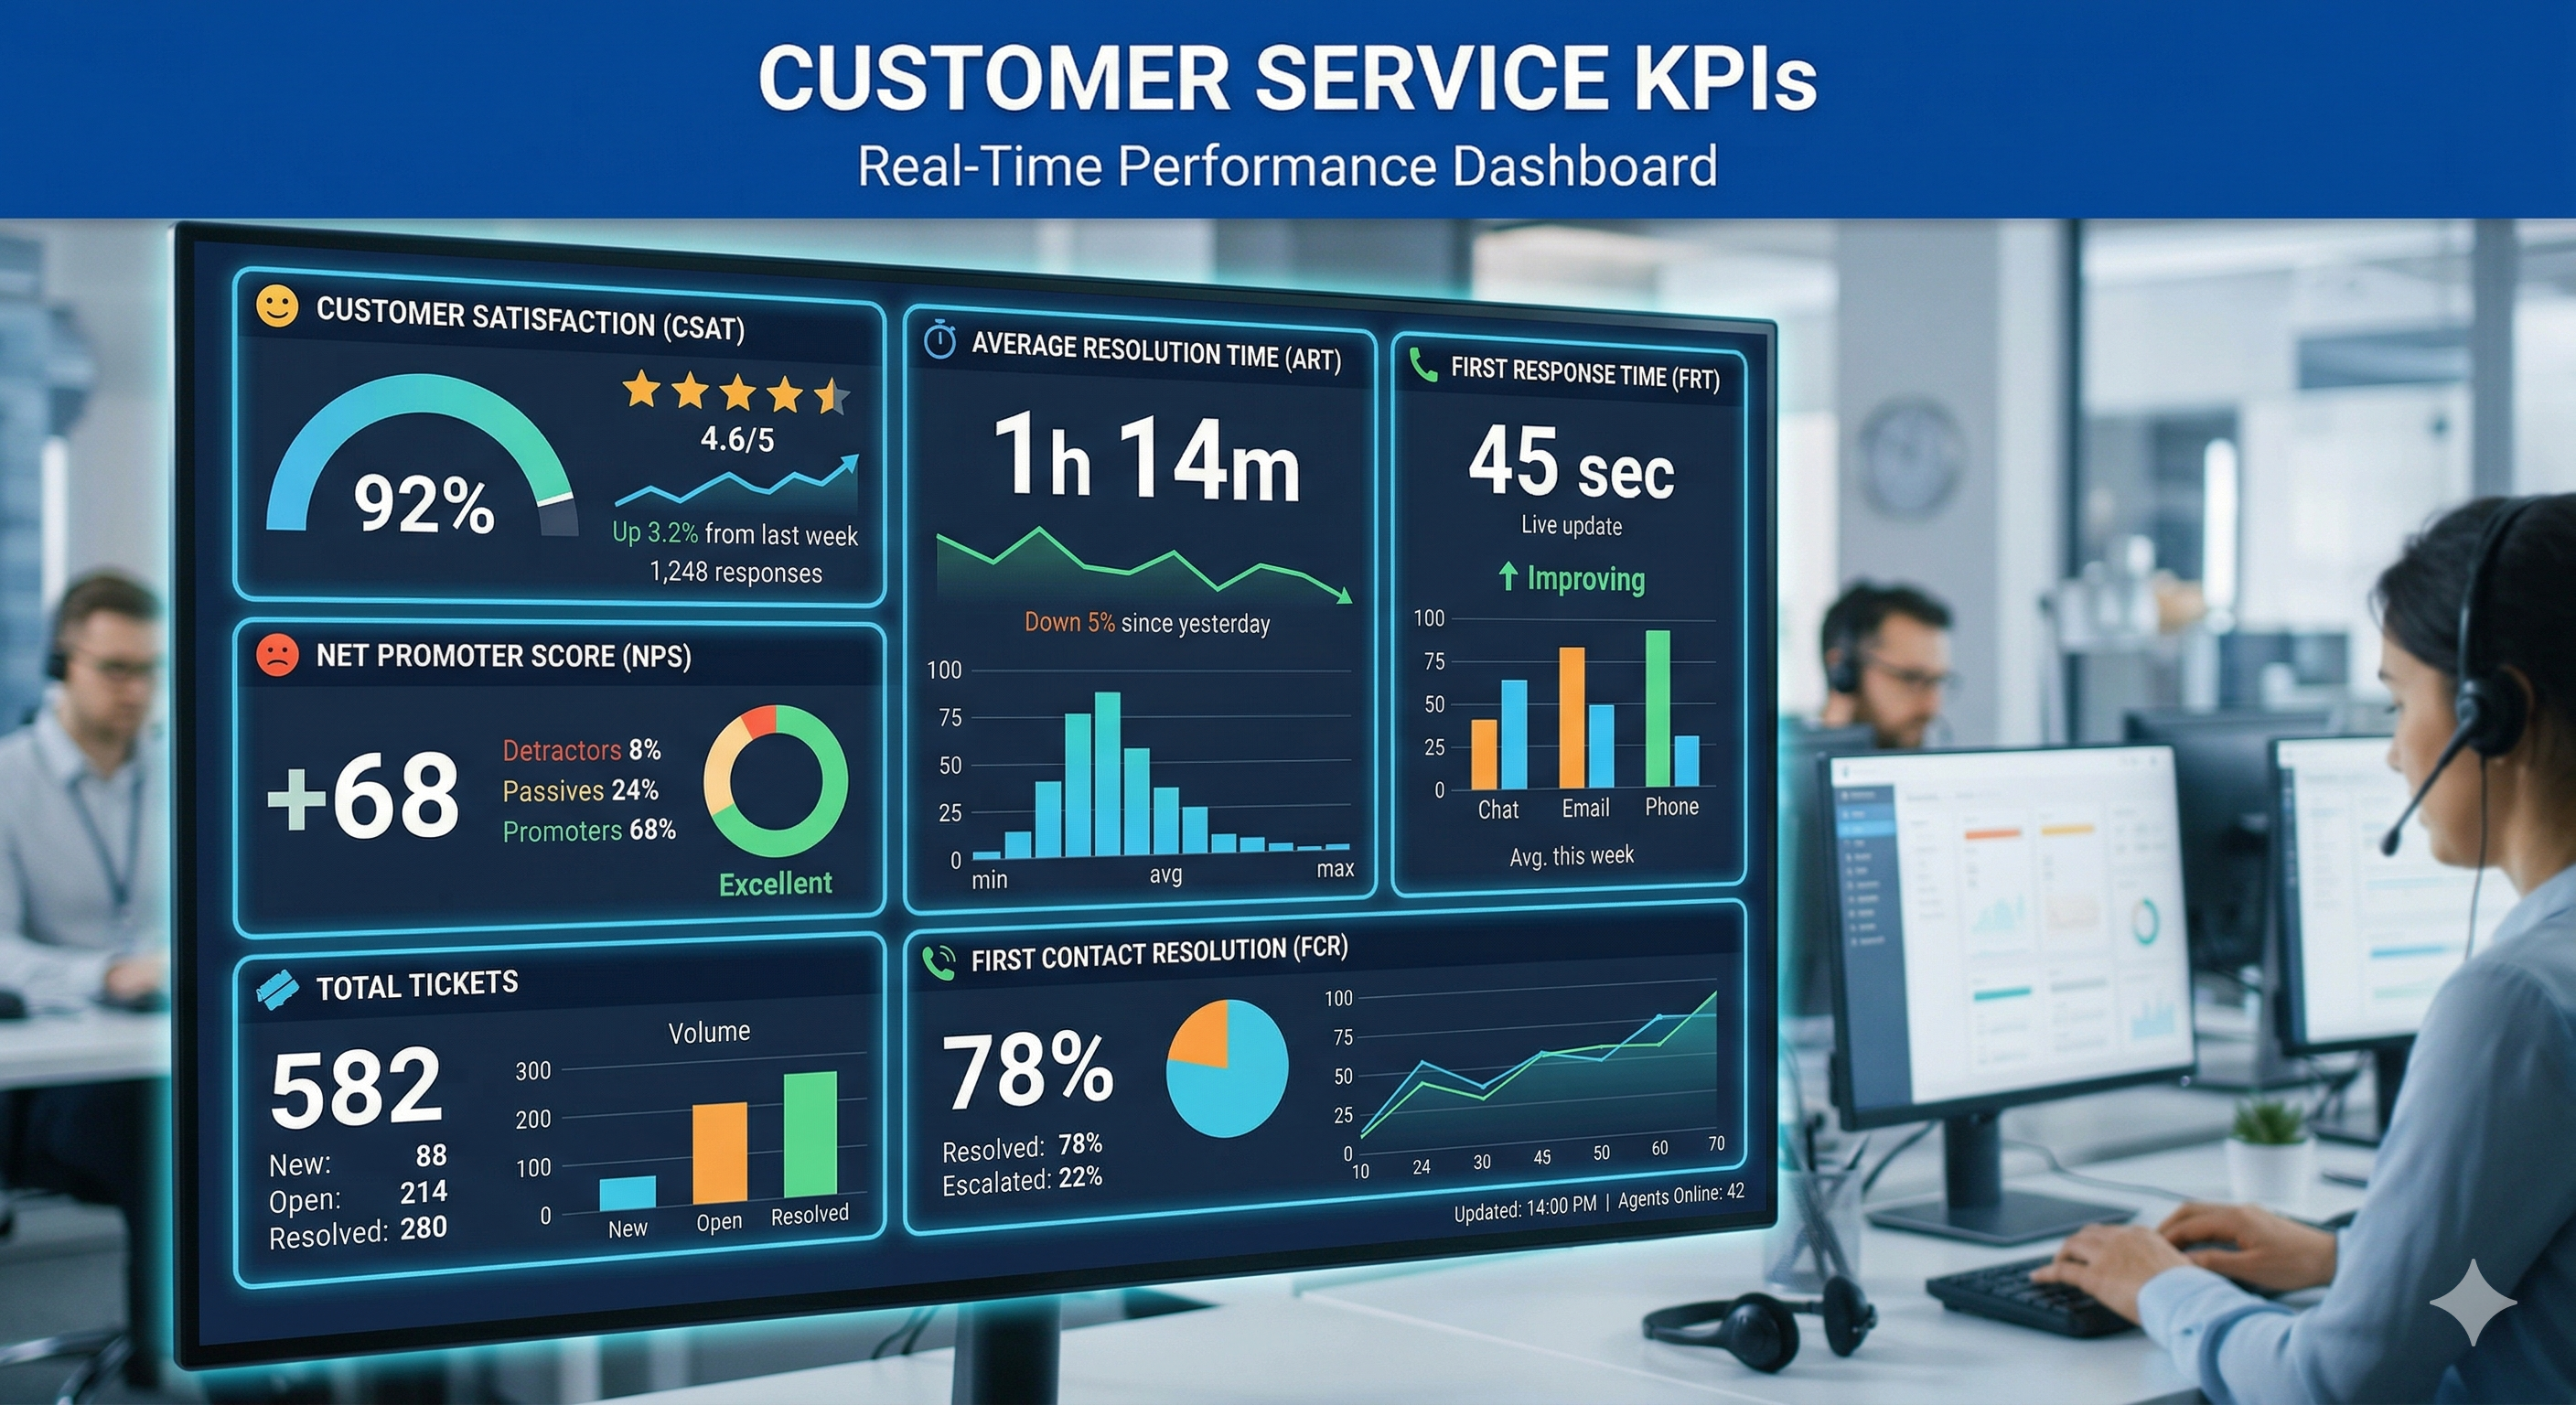
You can't improve what you don't measure. But with dozens of metrics floating around contact centers and support desks, knowing which customer service KPIs actually matter is half the battle. This guide breaks down the essential key performance indicators — what they are, how to calculate them, what good looks like, and how to move the needle on each one.
What Are Customer Service KPIs — and Why Do They Matter?
Customer service KPIs (Key Performance Indicators) are quantifiable metrics that measure how effectively your support team is delivering value to customers. Think of them as a real-time scoreboard for your entire customer experience operation.
Without tracking the right customer support metrics, you're flying blind. You might have a gut feeling that things are going well — or that they're not — but you won't know where to focus, how to coach your team, or where technology can fill the gap.
The best customer service KPIs do three things:
- Reveal exactly where customers are getting stuck or frustrated
- Give managers actionable data to coach and develop agents
- Tie support performance directly to business outcomes like retention and revenue
Now let's get into the ones that matter most.
The Top Customer Service KPIs Every Business Should Track
Customer Satisfaction Score (CSAT)
CSAT is arguably the most direct customer service KPI — it measures how satisfied a customer was with a specific interaction. It's collected via a post-interaction survey, usually a simple 1–5 or 1–10 rating scale, immediately after a support call, chat, or ticket resolution.
CSAT = (Number of Satisfied Responses ÷ Total Responses) × 100
What good looks like: Industry benchmarks typically sit between 75%–85%. Anything above 85% is excellent. Anything below 70% is a red flag worth investigating immediately.
How to improve it: Faster resolution, empathetic communication, and first-contact fixes are the biggest CSAT drivers. Visual remote assistance tools like Blitzz allow agents to see the customer's problem in real time — dramatically reducing back-and-forth and lifting satisfaction scores.
- Post-interaction survey
- Benchmark: 75%–85%+
- Red flag: below 70%
First Call Resolution (FCR)
First Call Resolution — also called First Contact Resolution — measures the percentage of customer issues resolved in a single interaction, without the need for a follow-up call, escalation, or callback. It's one of the most powerful contact center KPIs because it directly impacts cost, satisfaction, and loyalty all at once.
FCR = (Issues Resolved on First Contact ÷ Total Issues) × 100
What good looks like: A healthy FCR rate sits between 70%–75%. Top-performing teams consistently hit 80%+.
How to improve it: The biggest enemy of FCR is information asymmetry — agents can't fix what they can't see. When agents can visually assess a customer's situation via live video and AR annotation, first-contact resolution rates jump dramatically. Blitzz customers have reported up to 3x faster issue resolution after implementing visual remote support.
- CRM or call tracking
- Benchmark: 70%–80%+
- Red flag: below 60%
Net Promoter Score (NPS)
NPS measures customer loyalty, not just satisfaction with a single interaction. It answers the question: "How likely are you to recommend us to a friend or colleague?" Customers are categorized as Promoters (9–10), Passives (7–8), or Detractors (0–6).
NPS = % Promoters − % Detractors
What good looks like: NPS can range from -100 to +100. A score above 0 is generally positive; above 50 is excellent. The average NPS for B2B software sits around 31.
Why it matters for support: While NPS is typically a company-wide metric, your support team has an outsized influence on it. A single bad support experience can turn a Promoter into a Detractor. Consistently excellent service builds the loyal customer base that drives word-of-mouth growth.
- Quarterly or post-interaction survey
- Benchmark: 30–50+
- Red flag: negative score
Average Handle Time (AHT)
Average Handle Time measures how long it takes an agent to complete a customer interaction from start to finish — including talk time, hold time, and after-call work. It's one of the most closely watched call center KPIs because it directly affects cost-per-contact and team capacity.
AHT = (Talk Time + Hold Time + After-Call Work) ÷ Total Calls
What good looks like: AHT varies widely by industry, but most contact centers target 4–6 minutes for general support. What matters more than the absolute number is the trend — are you reducing AHT without sacrificing CSAT?
The AHT trap to avoid: Chasing a lower AHT at the expense of resolution quality is a false economy. If you cut 2 minutes off handle time but customers call back twice as often, you've lost. The goal is smart efficiency — and visual support tools accelerate understanding faster than any script ever could.
- Call center platform
- Benchmark: 4–6 minutes
- Watch: rising AHT + falling CSAT
Customer Effort Score (CES)
CES is one of the most underrated customer experience metrics. It measures how much effort a customer had to exert to get their issue resolved. The higher the effort, the higher the churn risk — research by Gartner found that 96% of customers with a high-effort service interaction become more disloyal.
CES = Average score on "How easy was it to resolve your issue today?" (1–7 scale)
What good looks like: You want customers to rate their experience in the 5–7 range on a 7-point scale. Low CES scores are a direct predictor of churn.
How to reduce customer effort: Eliminate transfers, reduce time-to-resolution, and make it dead simple for customers to get help. No-download video support tools like Blitzz remove one of the biggest friction points — customers just click a link and they're connected.
- Post-interaction survey
- Target: 5–7 out of 7
- Red flag: below 4
Average Response Time / First Response Time (FRT)
First Response Time tracks how quickly your team acknowledges a customer's request — not necessarily resolves it, but responds. In the age of instant gratification, speed of acknowledgment matters enormously. Customers who wait too long abandon their ticket, get frustrated, and escalate on social media.
FRT = Total First Response Time ÷ Number of Tickets Resolved
What good looks like: For email, under 1 hour is strong. For live chat, under 1 minute. For phone, under 30 seconds for pickup is the gold standard.
How to improve it: Intelligent routing, AI-assisted triage, and making sure the right agent picks up the right ticket from the start. Better tools mean faster responses — and fewer handoffs.
- Help desk / ticketing
- Email: <1 hr · Chat: <1 min
- Red flag: >4 hrs for email
Customer Churn Rate
Churn rate measures the percentage of customers who stopped doing business with you in a given period. While this is broadly a business metric, customer service is one of its biggest levers — poor support experiences are a top driver of preventable churn across every industry.
Churn Rate = (Customers Lost ÷ Customers at Start of Period) × 100
What good looks like: Benchmarks vary dramatically by industry. SaaS averages 5–7% annual churn. Telecom can be 15–25%. In all cases, the goal is downward trend over time.
The support link: A single unresolved issue can flip a loyal customer into a churned one. Track which support tickets precede churn events — that's where your team needs to invest improvement.
- CRM / billing system
- SaaS target: below 5% annual
- Watch: post-support ticket churn
Ticket Volume & Ticket Deflection Rate
Ticket volume tracks the total number of support requests coming in. Ticket deflection rate measures how many of those were resolved without ever reaching a live agent — through self-service portals, chatbots, or automated responses. High deflection rates signal a scalable, efficient support operation.
Deflection Rate = (Deflected Tickets ÷ Total Tickets) × 100
What good looks like: World-class support organizations deflect 30–50% of ticket volume without sacrificing CSAT.
How to improve it: Invest in a robust knowledge base, intelligent chatbots, and video-based FAQ content. If customers can self-serve on common issues, your agents have more time to focus on complex problems that actually need a human touch.
- Help desk / chatbot platform
- Target deflection: 30–50%
- Watch: deflection + CSAT together
Agent Utilization Rate
Agent utilization measures the percentage of time your agents spend on productive, billable support work versus idle time. It's a critical contact center KPI for workforce management — too low and you're overstaffed; too high and you're burning agents out and degrading service quality.
Utilization Rate = (Productive Time ÷ Total Logged-in Time) × 100
What good looks like: Most contact centers target 75%–85% utilization. Above 90% consistently is a warning sign for burnout and quality degradation.
The visual support angle: Tools that reduce AHT naturally free up agent capacity. When a Blitzz visual session resolves an issue in 4 minutes that would've taken 15 over the phone, that agent can take 3 more interactions per hour — without burning out.
- Workforce management system
- Benchmark: 75%–85%
- Red flag: above 90% sustained
Cost Per Contact (CPC)
Cost Per Contact is the total operational cost of your support team divided by the total number of contacts handled. It's the essential customer service performance metric for business leaders who need to justify support budgets — and find opportunities to reduce cost without reducing quality.
CPC = Total Support Costs ÷ Total Number of Contacts
What good looks like: Industry averages typically range from $5 to $50+ per contact depending on the channel and complexity. Phone support is typically the most expensive; chat and self-service the least.
How to reduce it: Improve FCR (fewer repeat contacts), reduce AHT, increase deflection, and eliminate unnecessary field dispatches. One truck roll can cost $200–$500+. Resolving the same issue with visual remote assistance costs a fraction of that.
-
Finance / workforce data
-
Lower is better — track trend
-
Watch: field dispatch costs

Quick Reference: Customer Service KPIs at a Glance
Here's a consolidated view of the top customer service KPIs, their benchmarks, and what they signal about your team's performance.
|
KPI |
What It Measures |
Benchmark |
Priority |
|
CSAT |
Satisfaction with interaction |
75%–85%+ |
Must-track |
|
First Call Resolution |
Issue resolved in one contact |
70%–80%+ |
Must-track |
|
Net Promoter Score |
Customer loyalty & advocacy |
30–50+ |
Must-track |
|
Average Handle Time |
Duration of interaction |
4–6 minutes |
Operational |
|
Customer Effort Score |
How hard it was to get help |
5–7 out of 7 |
High value |
|
First Response Time |
Speed of first acknowledgment |
<1 hr (email) |
Operational |
|
Churn Rate |
Customers lost per period |
<5–7% (SaaS) |
Must-track |
|
Ticket Deflection Rate |
Self-service resolution rate |
30%–50% |
Efficiency |
|
Agent Utilization |
Productive vs. idle time |
75%–85% |
Efficiency |
|
Cost Per Contact |
Cost to handle each interaction |
Industry-specific |
Business ROI |
How to Actually Improve Your Customer Service KPIs
Tracking KPIs is step one. Improving them is where the real work — and real differentiation — happens. Here's what the highest-performing support teams do differently.
1. Give Agents the Right Tools, Not Just More Training
Coaching helps, but agents can only perform as well as their tools allow. If they're trying to diagnose a technical issue from a customer's verbal description over the phone, no amount of soft-skills training will compensate for the information gap. Visual remote assistance changes the equation — agents can see what the customer sees, annotate in real time, and guide them to resolution without a single truck roll or escalation.
2. Track KPIs Together, Not in Isolation
No single customer service KPI tells the full story. AHT going down while CSAT also drops? You might be rushing agents. FCR going up but so is churn? You might be resolving the symptom, not the root cause. Always look at your KPI dashboard holistically — the interactions between metrics are where the real insights live.
3. Identify Your Top Drivers of Poor Performance
Use your KPI data to identify patterns. Which agents have the lowest FCR? Which product categories generate the most repeat contacts? Which channels produce the highest customer effort? Then design targeted interventions rather than blanket programs.
4. Close the Loop With Customers
CSAT and NPS surveys are only valuable if you act on them. Build a process to follow up with detractors within 24–48 hours. Not only does this often recover the relationship — it generates the richest qualitative insight into what's actually breaking down in your support experience.
5. Invest in Technology That Reduces Friction at the Point of Contact
The fastest way to improve the majority of customer service KPIs simultaneously is to reduce friction in the actual support interaction. That means faster access to context, better tools for real-time problem-solving, and fewer handoffs. Platforms like Blitzz that combine live video, AR annotations, and automatic CRM sync tackle AHT, FCR, CSAT, and CES all in a single interaction.
Transforms Customer Service KPIs
There's a reason leading telecom providers, manufacturers, insurers, and retailers are investing heavily in visual remote assistance. It's not a novelty — it's one of the most measurable ROI drivers in modern customer service.
Here's how Blitzz's visual support platform moves the needle on the KPIs that matter most:
- FCR:Agents resolve issues on first contact because they can actually see the problem — no guessing, no callbacks
- AHT:Visual context eliminates lengthy verbal descriptions and back-and-forth, cutting handle time by up to 65%
- CSAT:Customers feel understood and helped faster — satisfaction scores rise when resolution feels effortless
- CES:One click and they're connected — no app downloads, no complicated setup, zero friction
- Cost Per Contact:Fewer dispatches, fewer repeat contacts, and higher agent efficiency drive significant cost reduction
- Churn Rate:Customers who get their problem fixed quickly and painlessly don't leave — it really is that simple
FAQs: Customer Service KPIs
What are the most important customer service KPIs?
The most universally important customer service KPIs are CSAT (Customer Satisfaction Score), First Call Resolution, and Net Promoter Score. These three metrics give you a complete picture of how customers feel in the moment, whether their problems are actually getting solved, and whether they'd recommend you to others. Beyond these, Average Handle Time, Customer Effort Score, and Cost Per Contact round out a comprehensive performance dashboard.
How often should you review customer service KPIs?
Operational KPIs like AHT, FCR, and response time should be reviewed weekly or even daily by team leads. Strategic metrics like NPS and churn rate are better reviewed monthly or quarterly. The key is having a consistent cadence and acting on what you find — reviews without action are just overhead.
What's the difference between customer service KPIs and customer service metrics?
Every KPI is a metric, but not every metric is a KPI. A KPI is a metric that's been designated as critical to achieving a specific business goal — it's tied to a target, reviewed regularly, and used to drive decisions. "Number of tickets opened today" is a metric. "First Call Resolution rate against a 75% target" is a KPI.
How can small businesses track customer service KPIs without enterprise software?
Most modern helpdesk platforms — Zendesk, Freshdesk, Intercom — include built-in KPI dashboards even on basic plans. For CSAT and NPS, simple survey tools work fine. The most important thing isn't the sophistication of your tooling; it's the consistency of your measurement and your willingness to act on the data. Start with three KPIs, measure them consistently, and expand from there.
What customer service KPIs should a contact center prioritize?
Contact centers should prioritize FCR, AHT, CSAT, Agent Utilization, and Cost Per Contact as their core KPI set. These five metrics give a complete picture of efficiency, quality, and cost — the three things every contact center leader is accountable for. Layer in Customer Effort Score and NPS for a fuller view of the customer experience beyond individual interactions.